
Century 21 People’s Choice Realty Inc., Brokerage
120 MATHESON BLVD E #103
MISSISSAUGA, Ontario
L4Z 1X1
London East, East M, N5W 2N2
$428,999
Listed by ROYAL LEPAGE TERREQUITY REALTY.
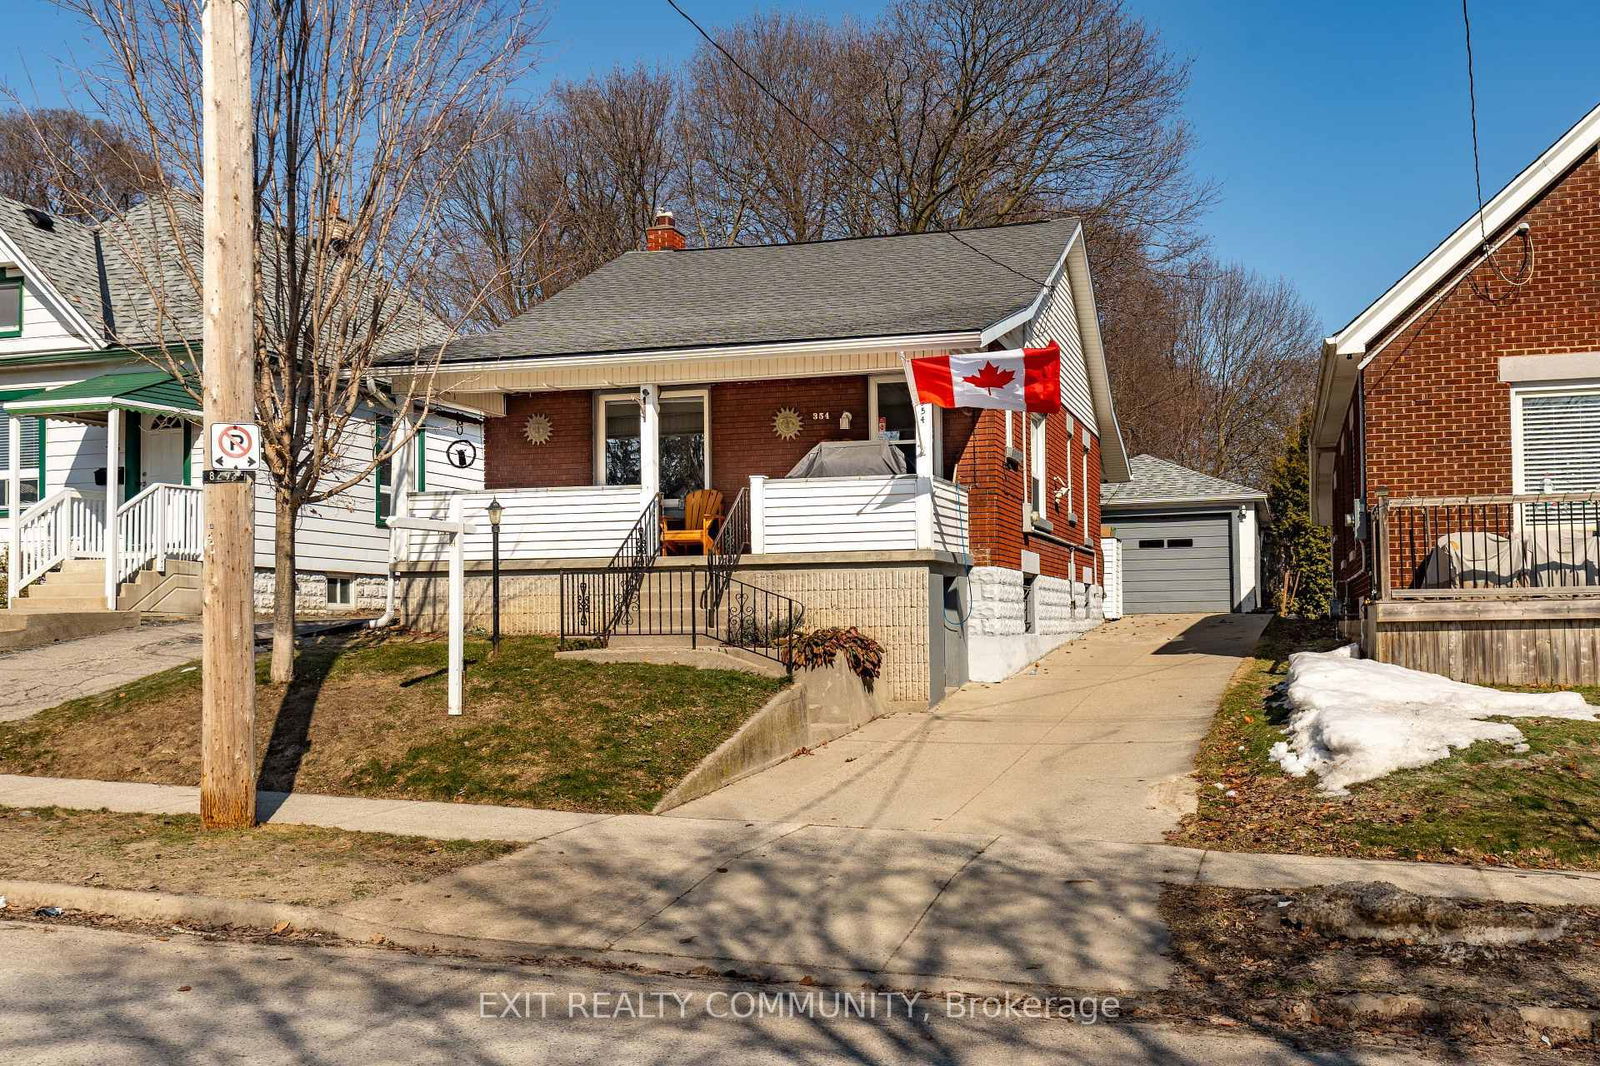
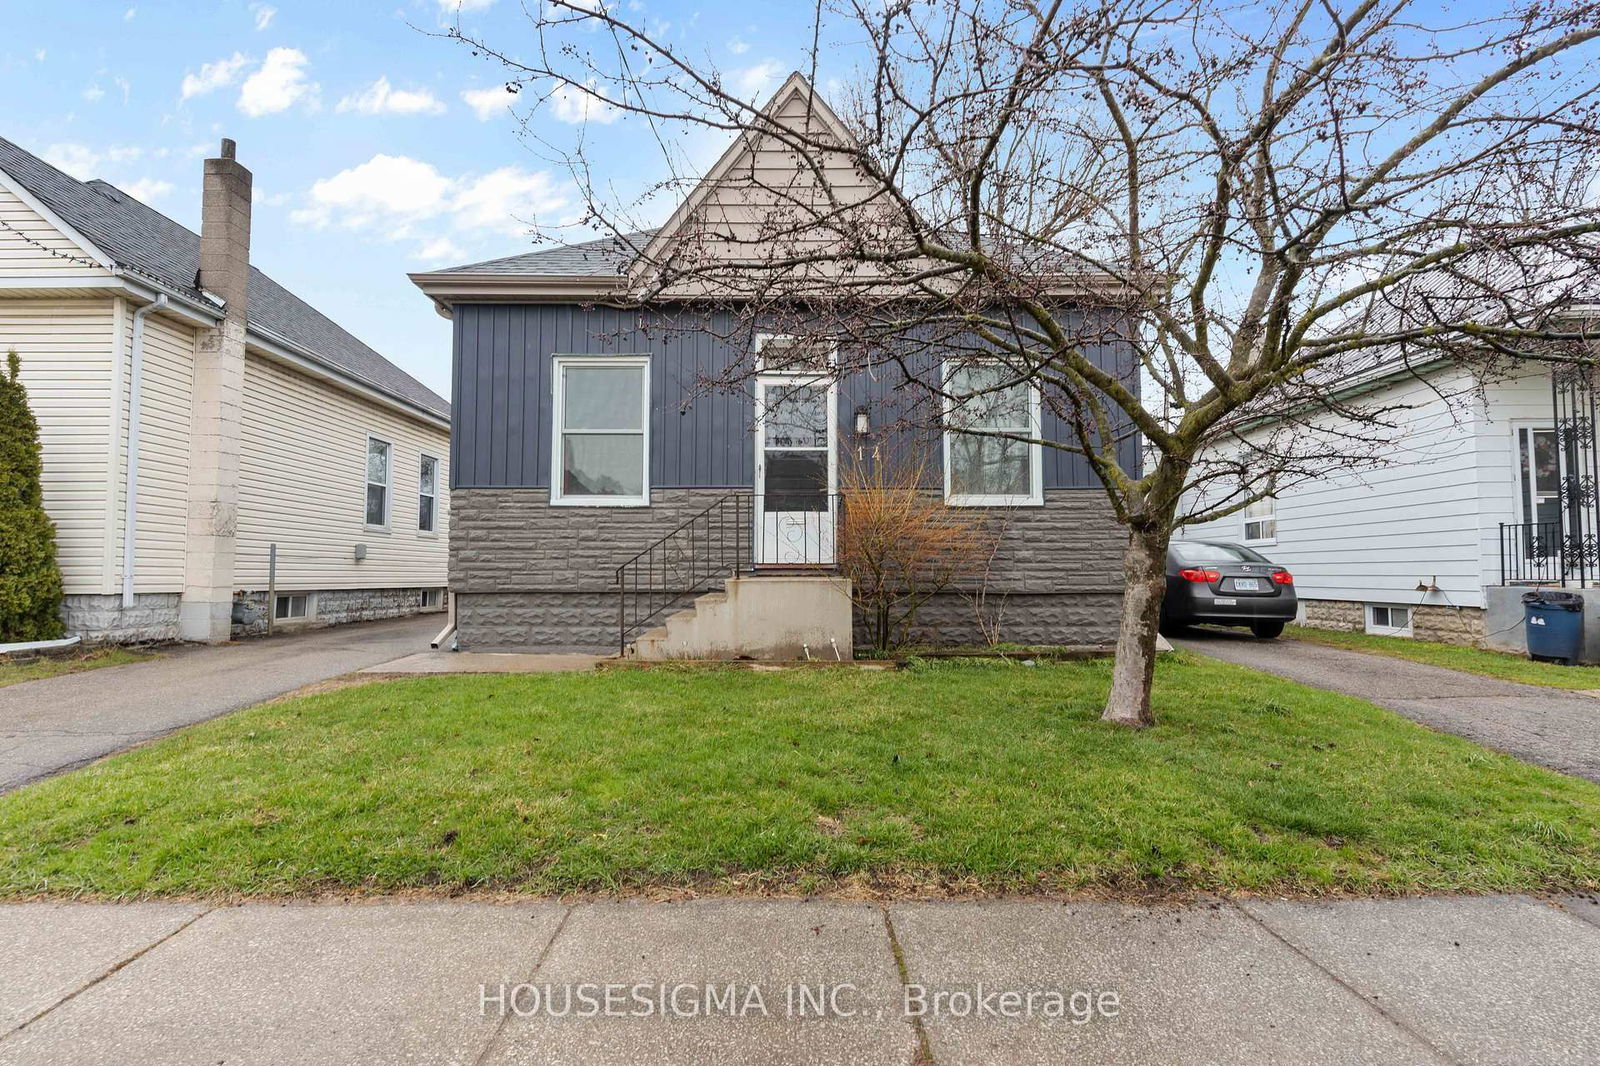
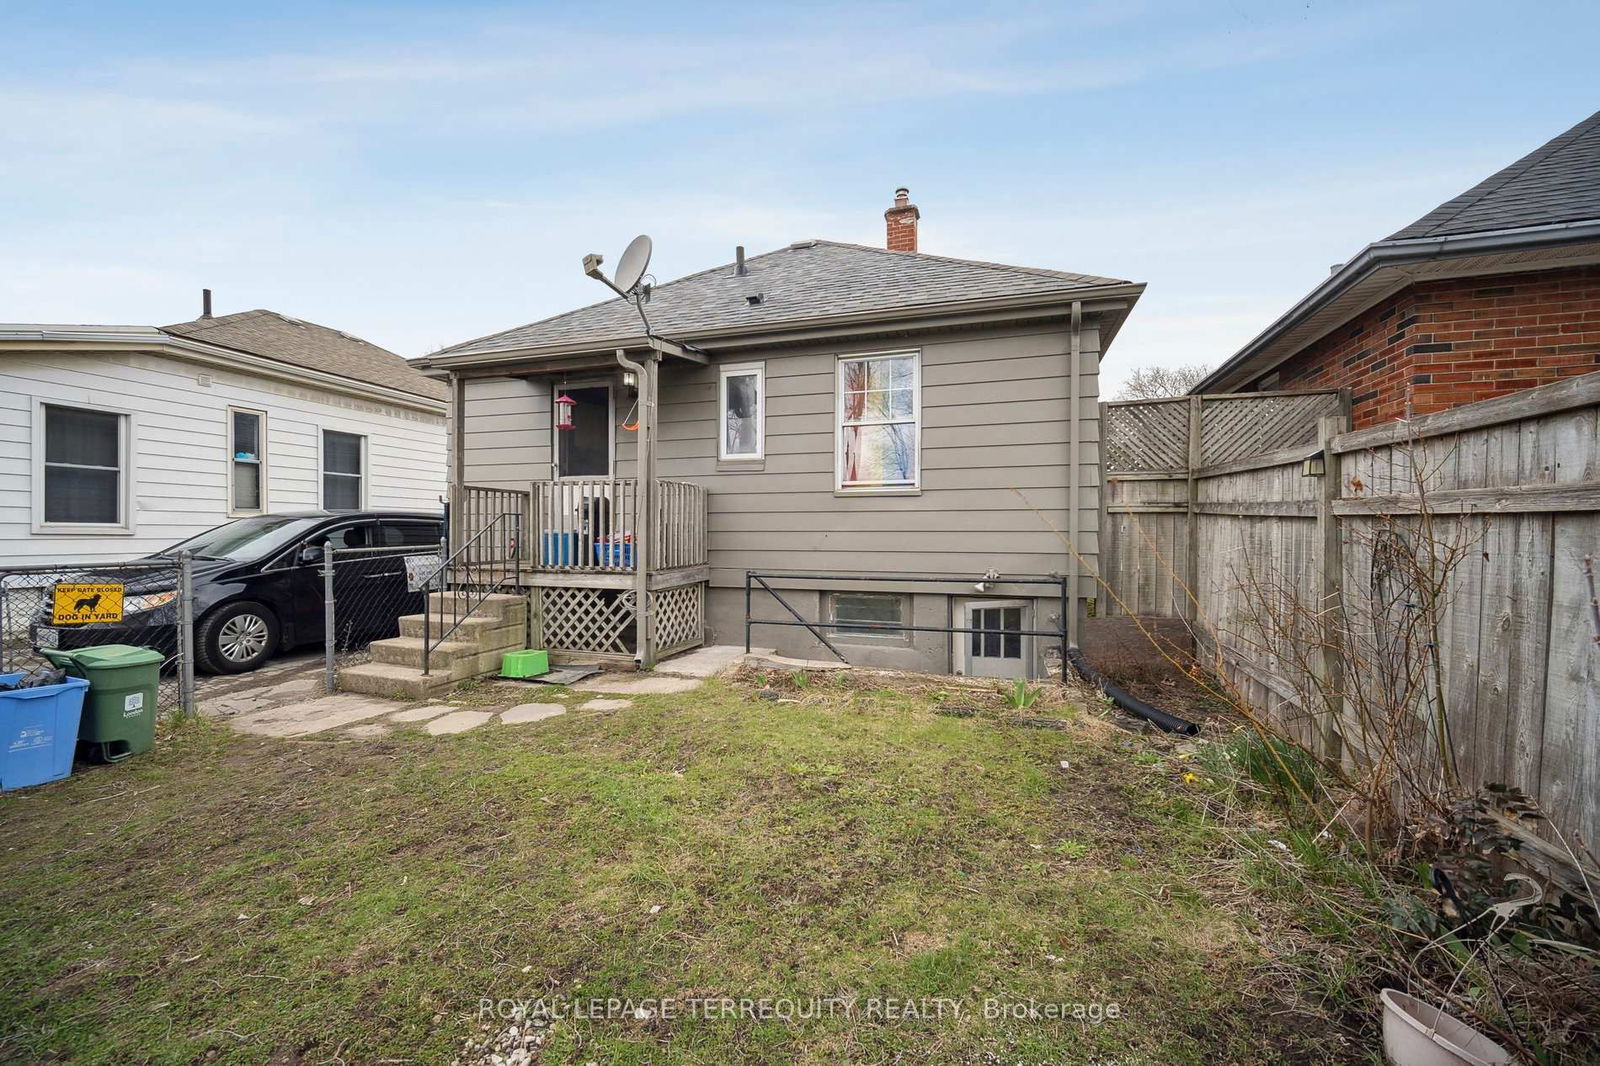
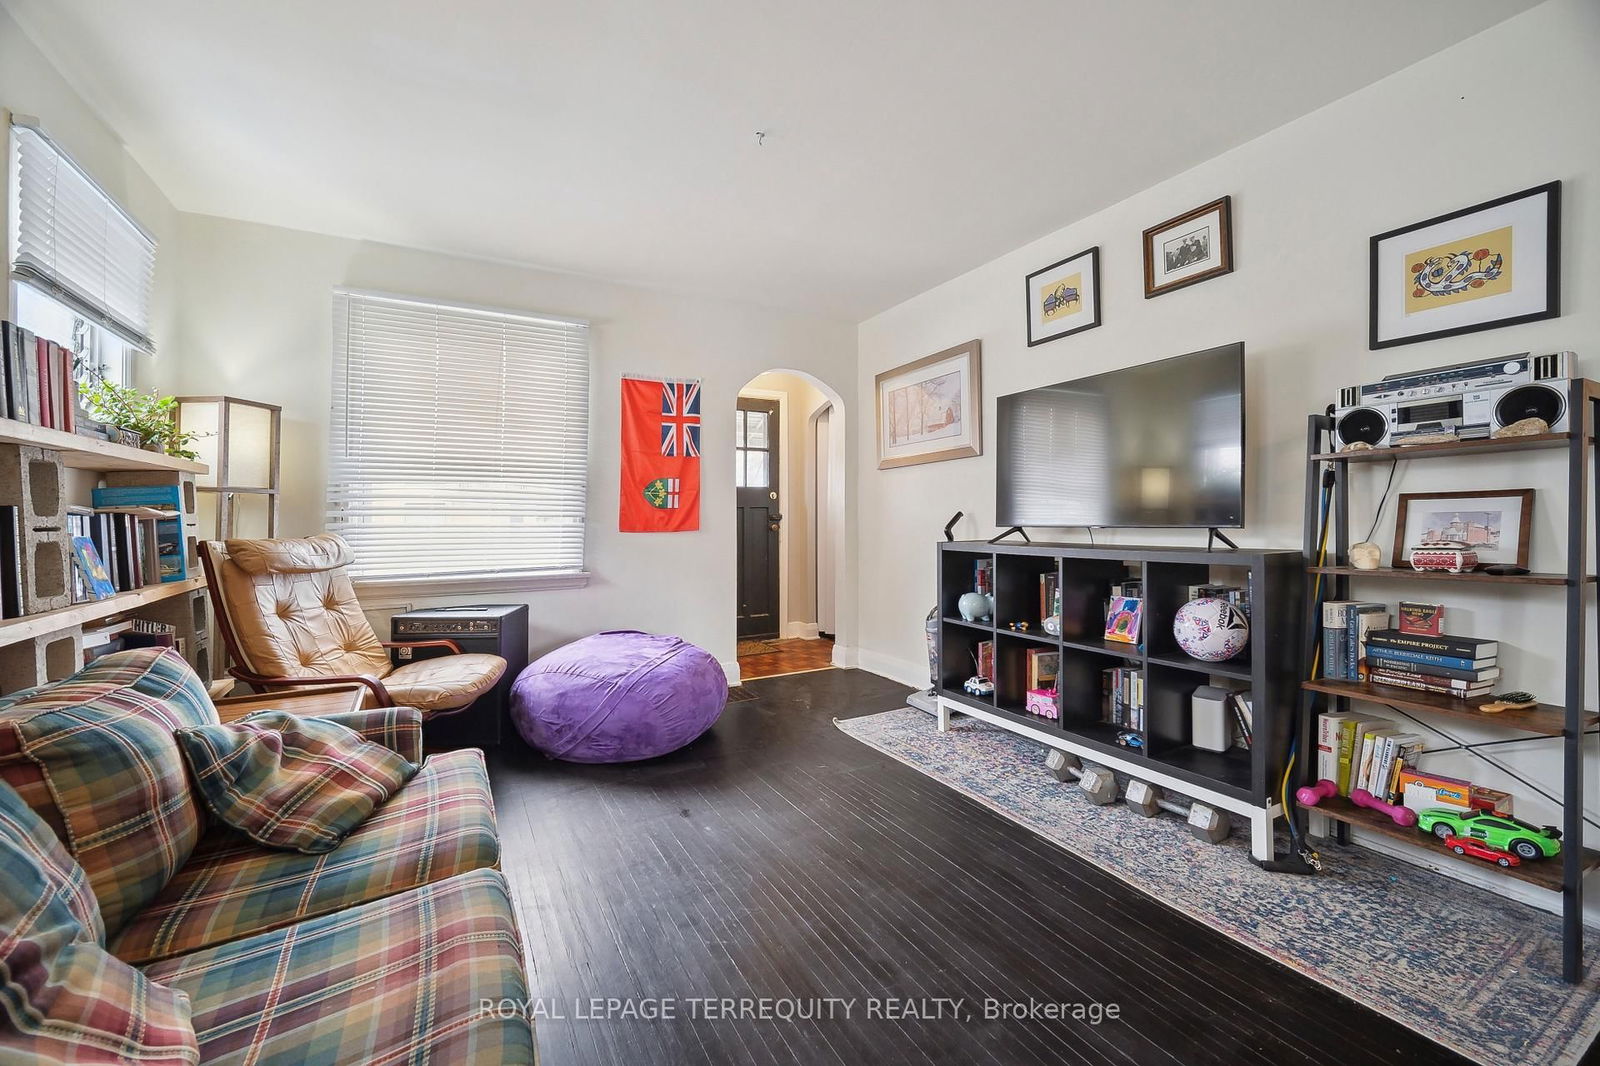
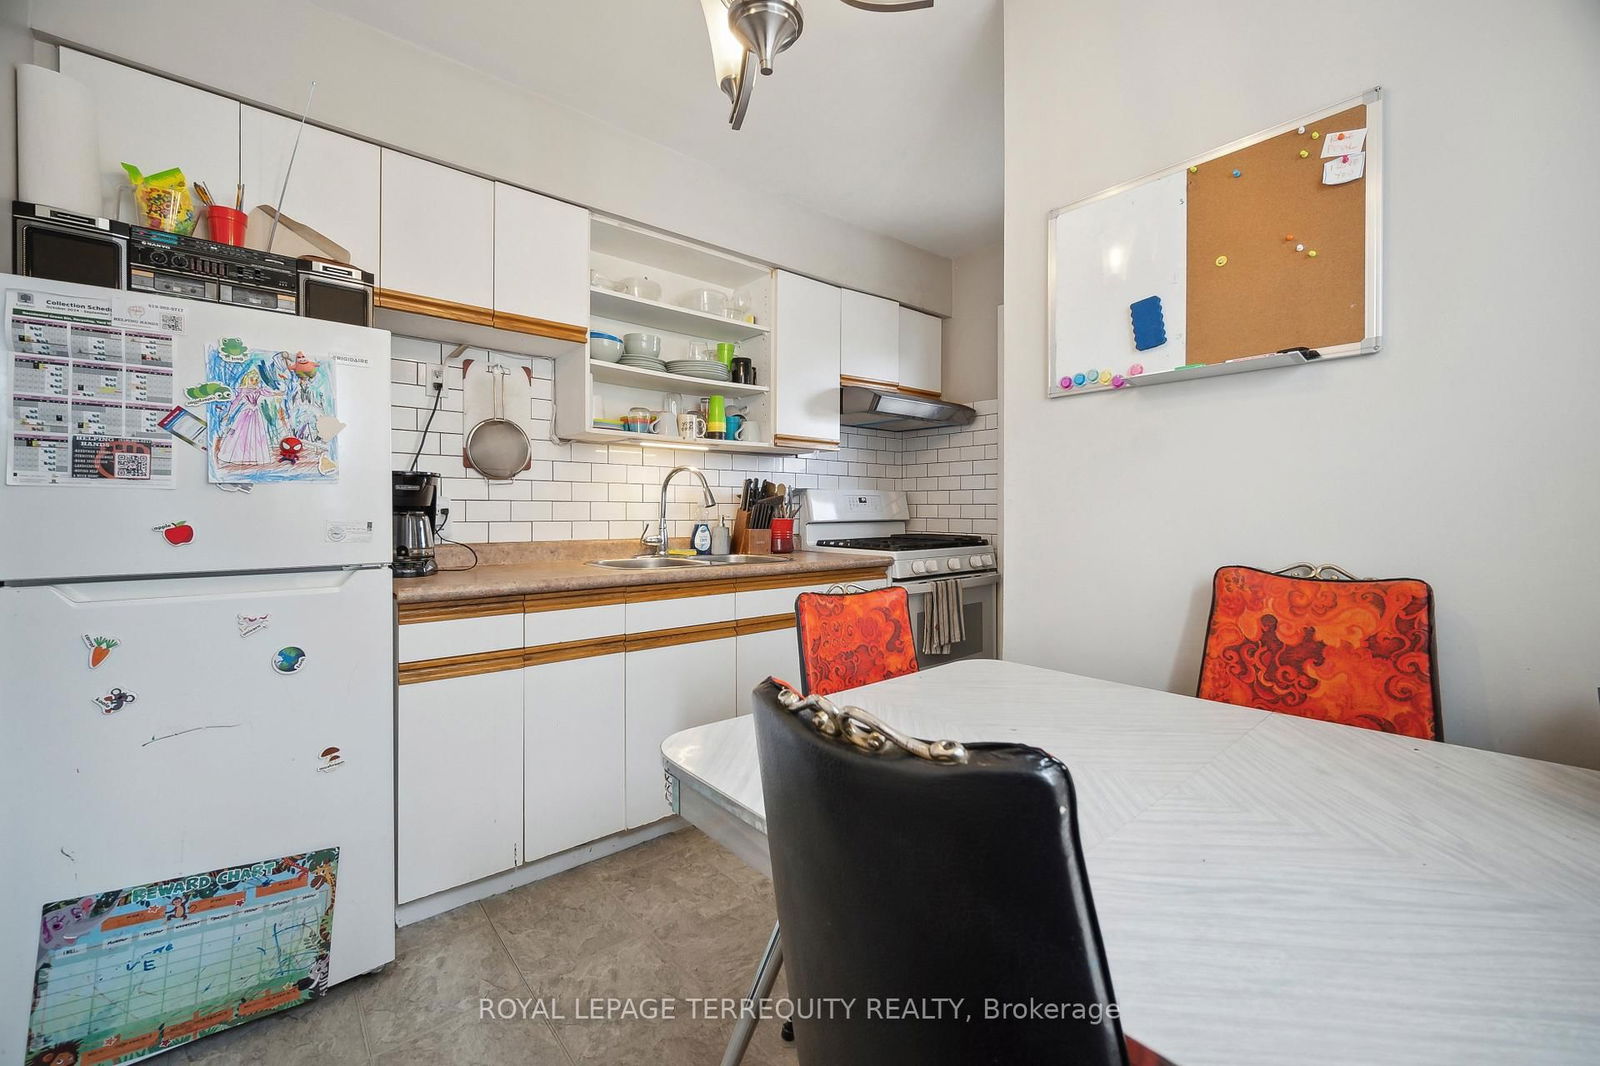
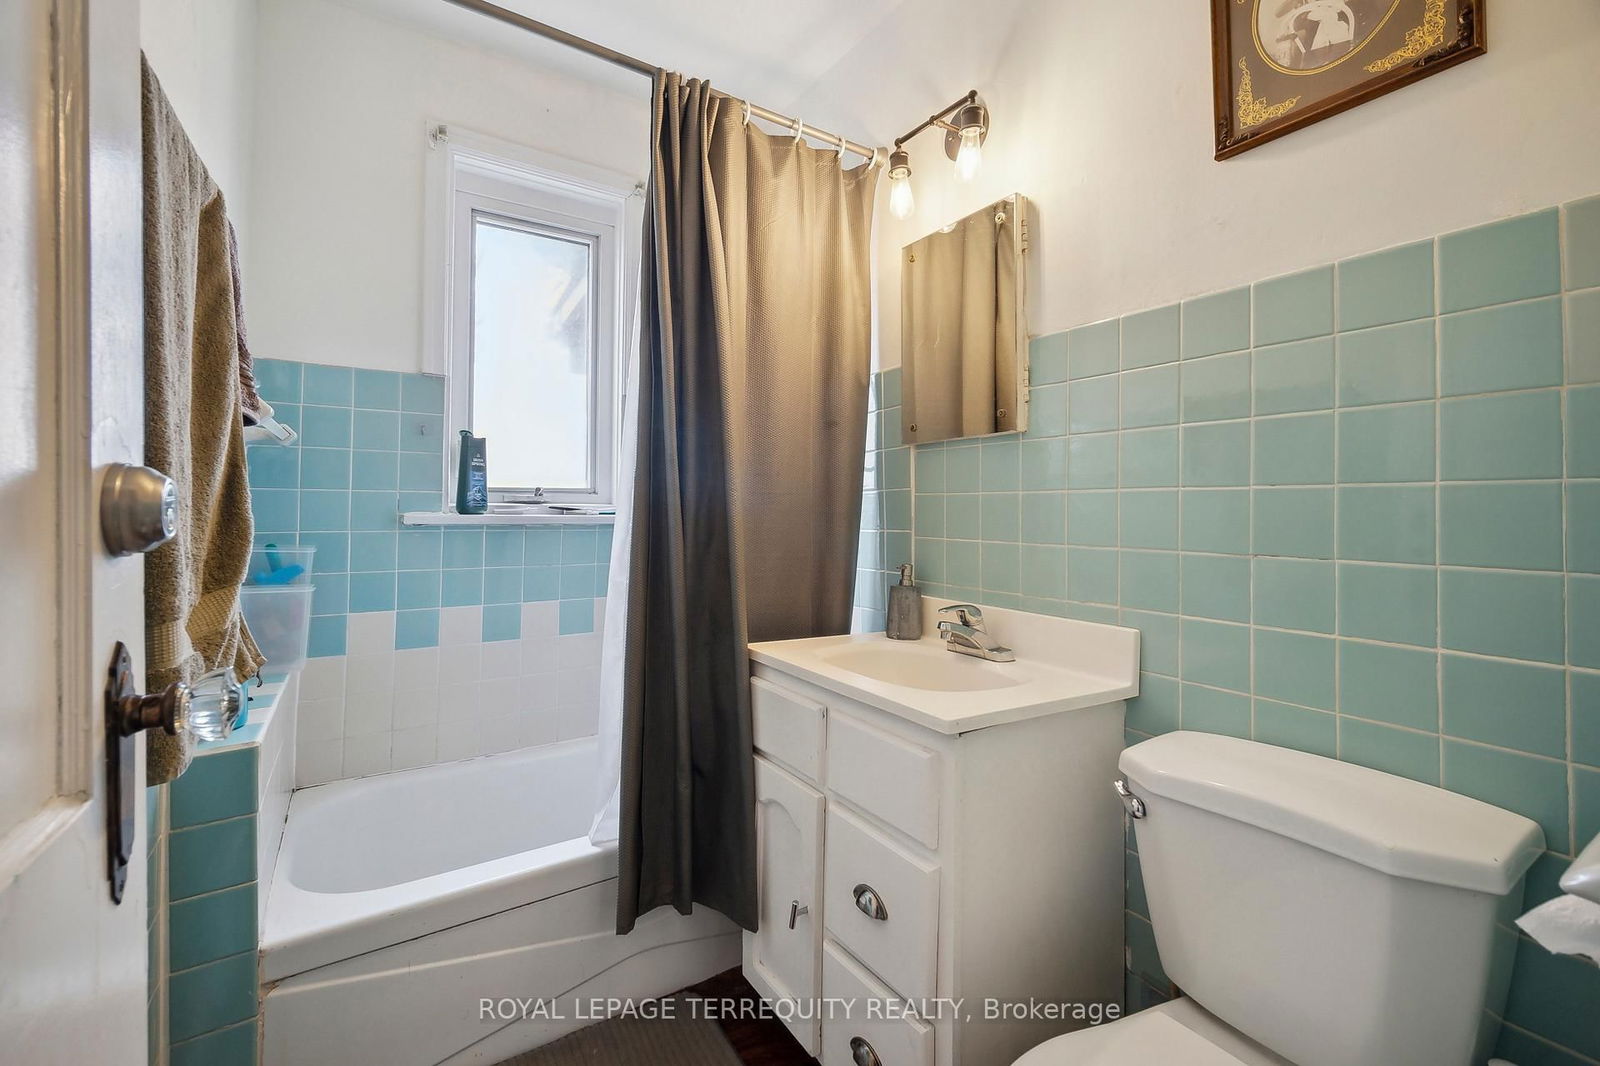
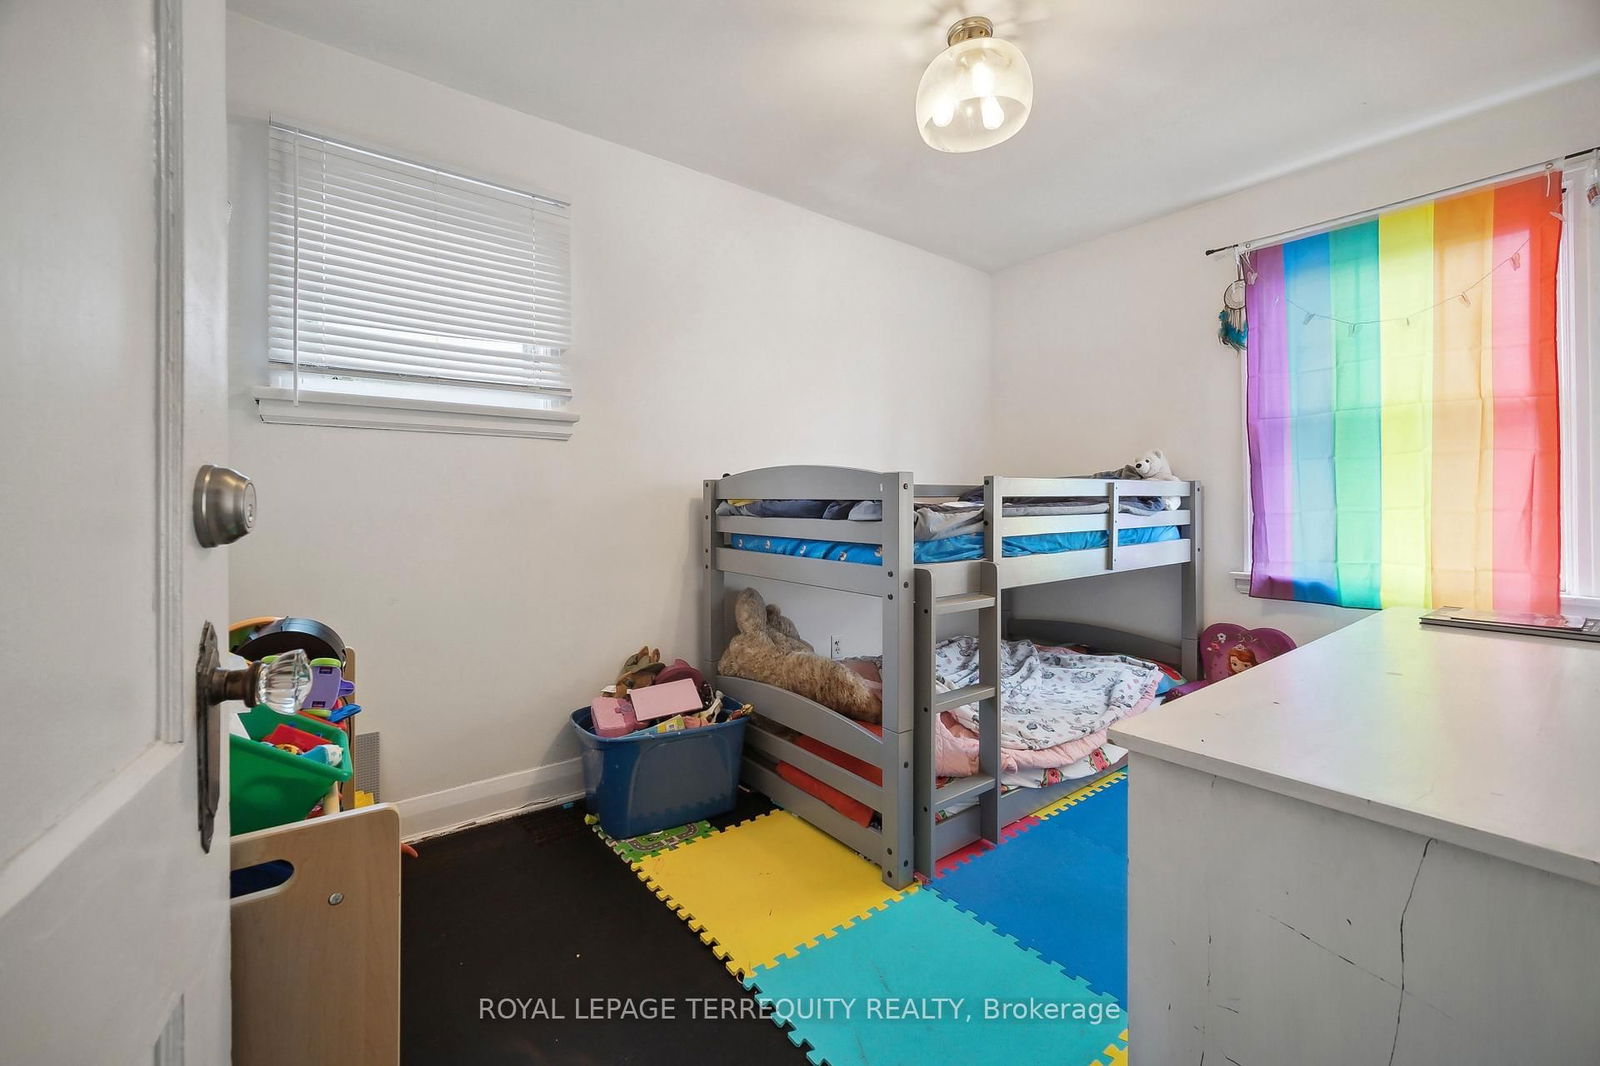
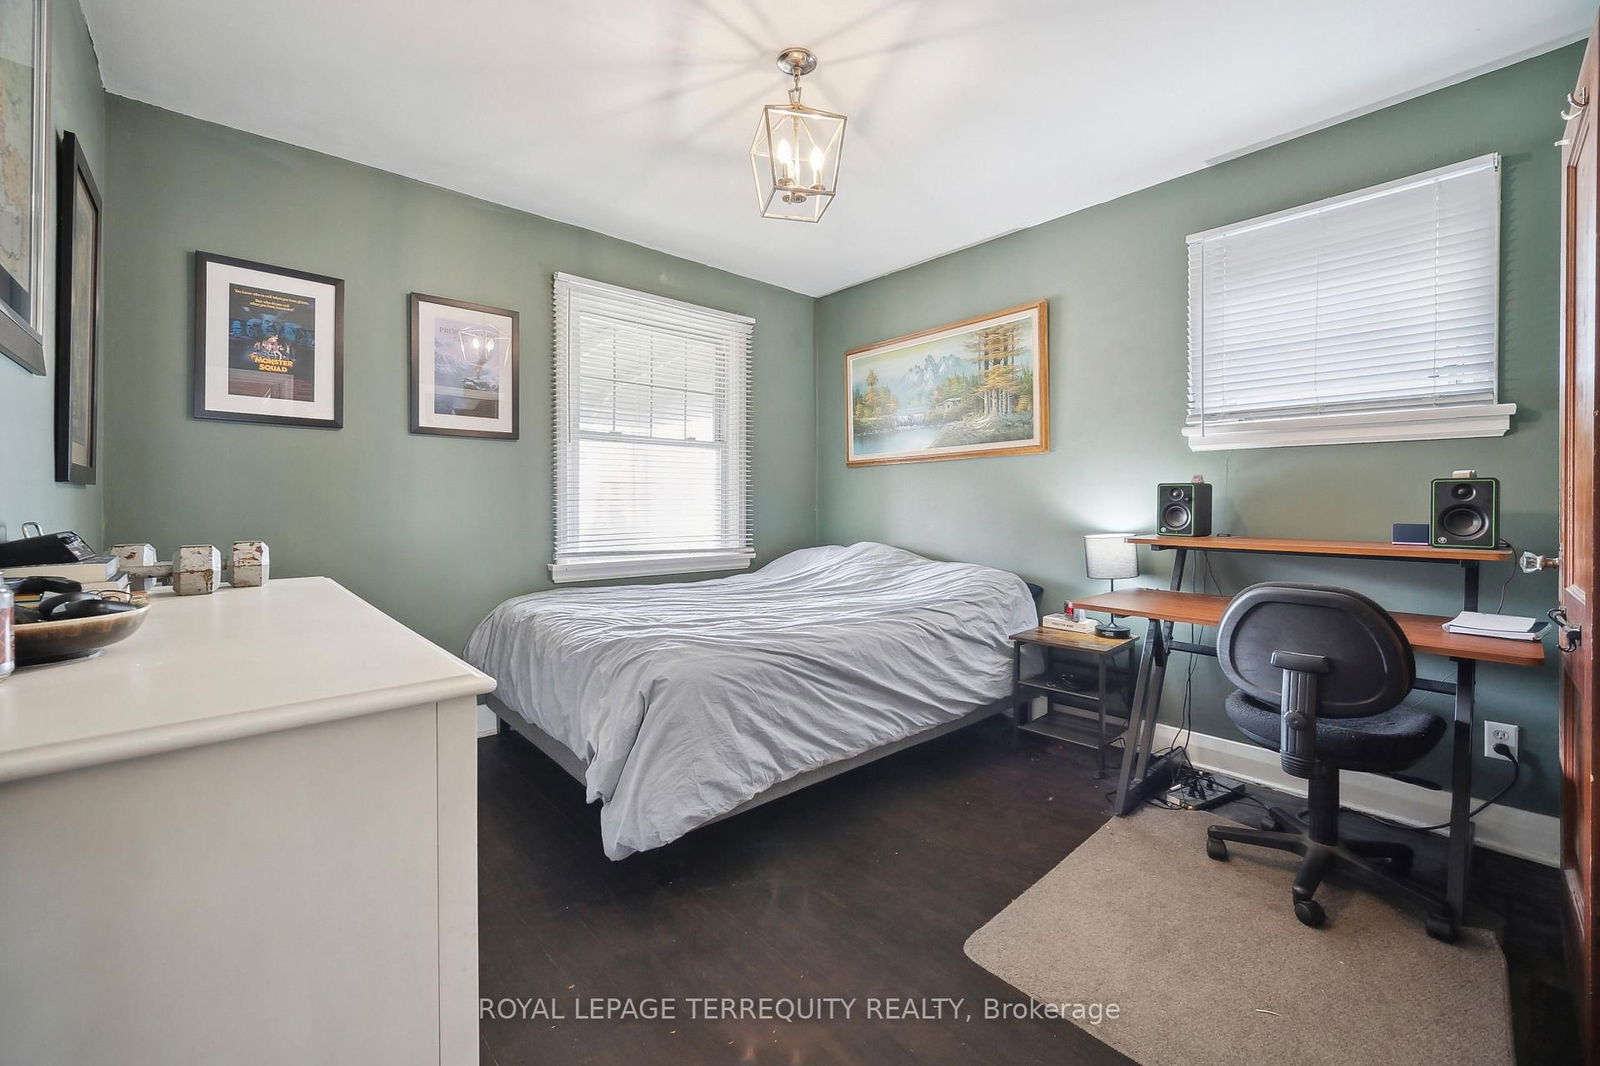
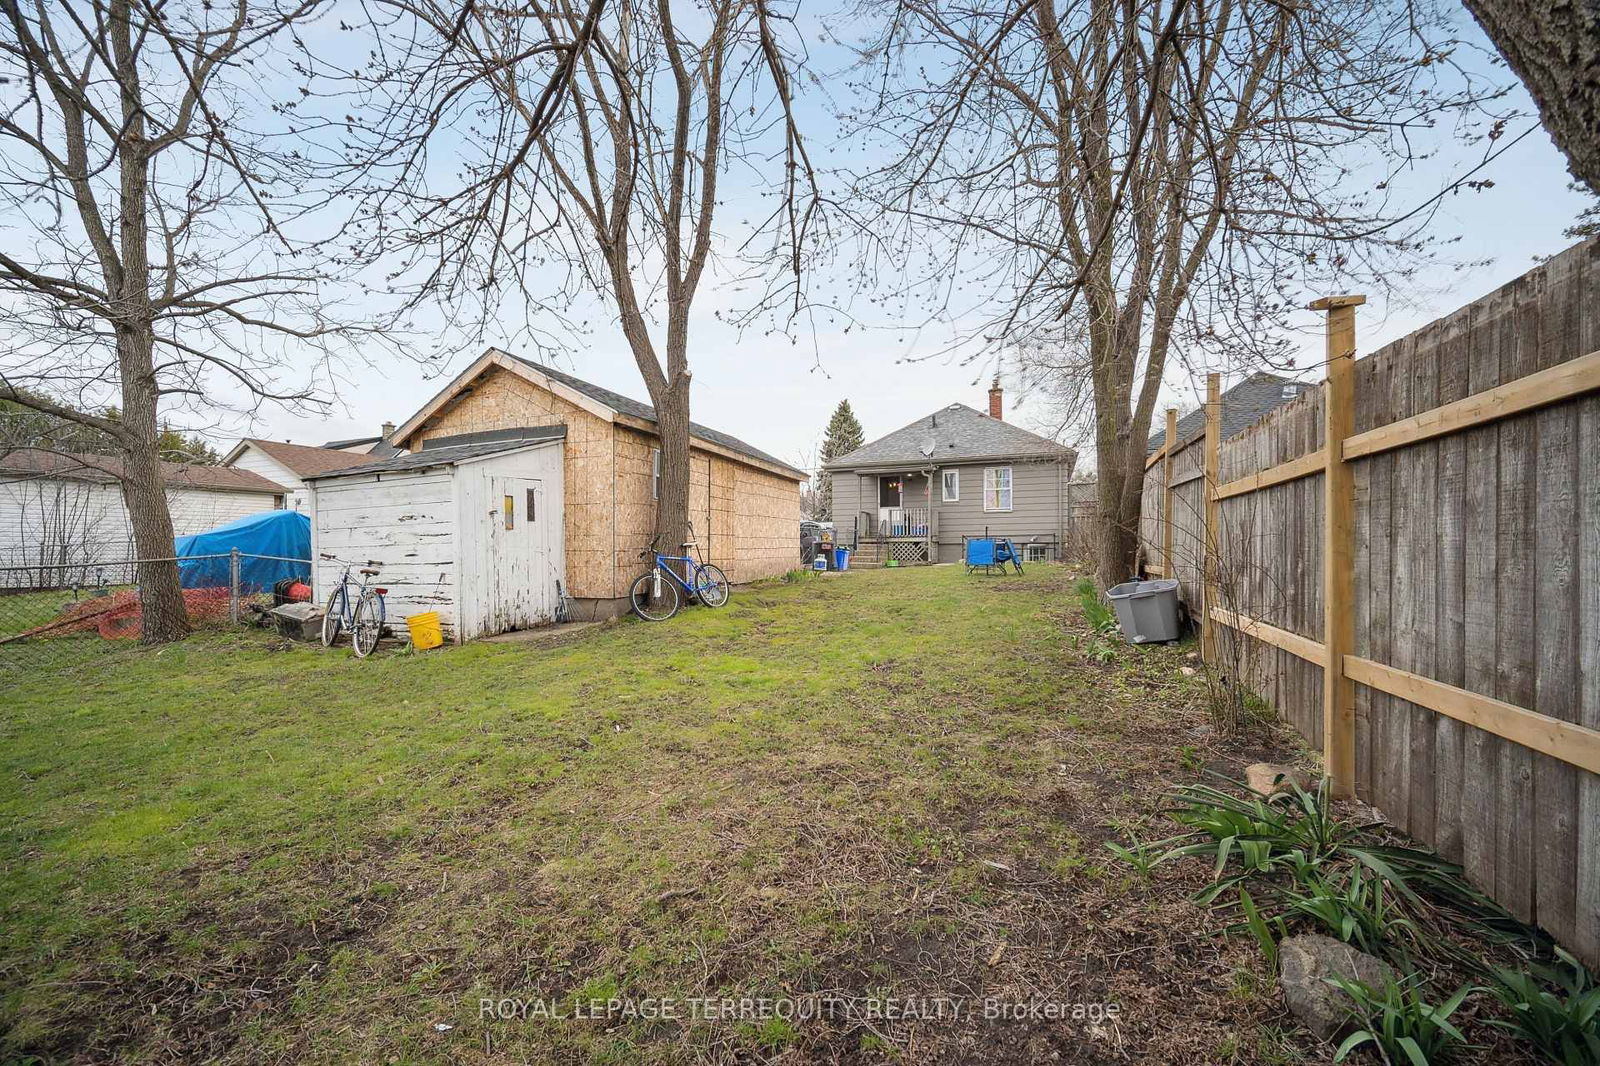
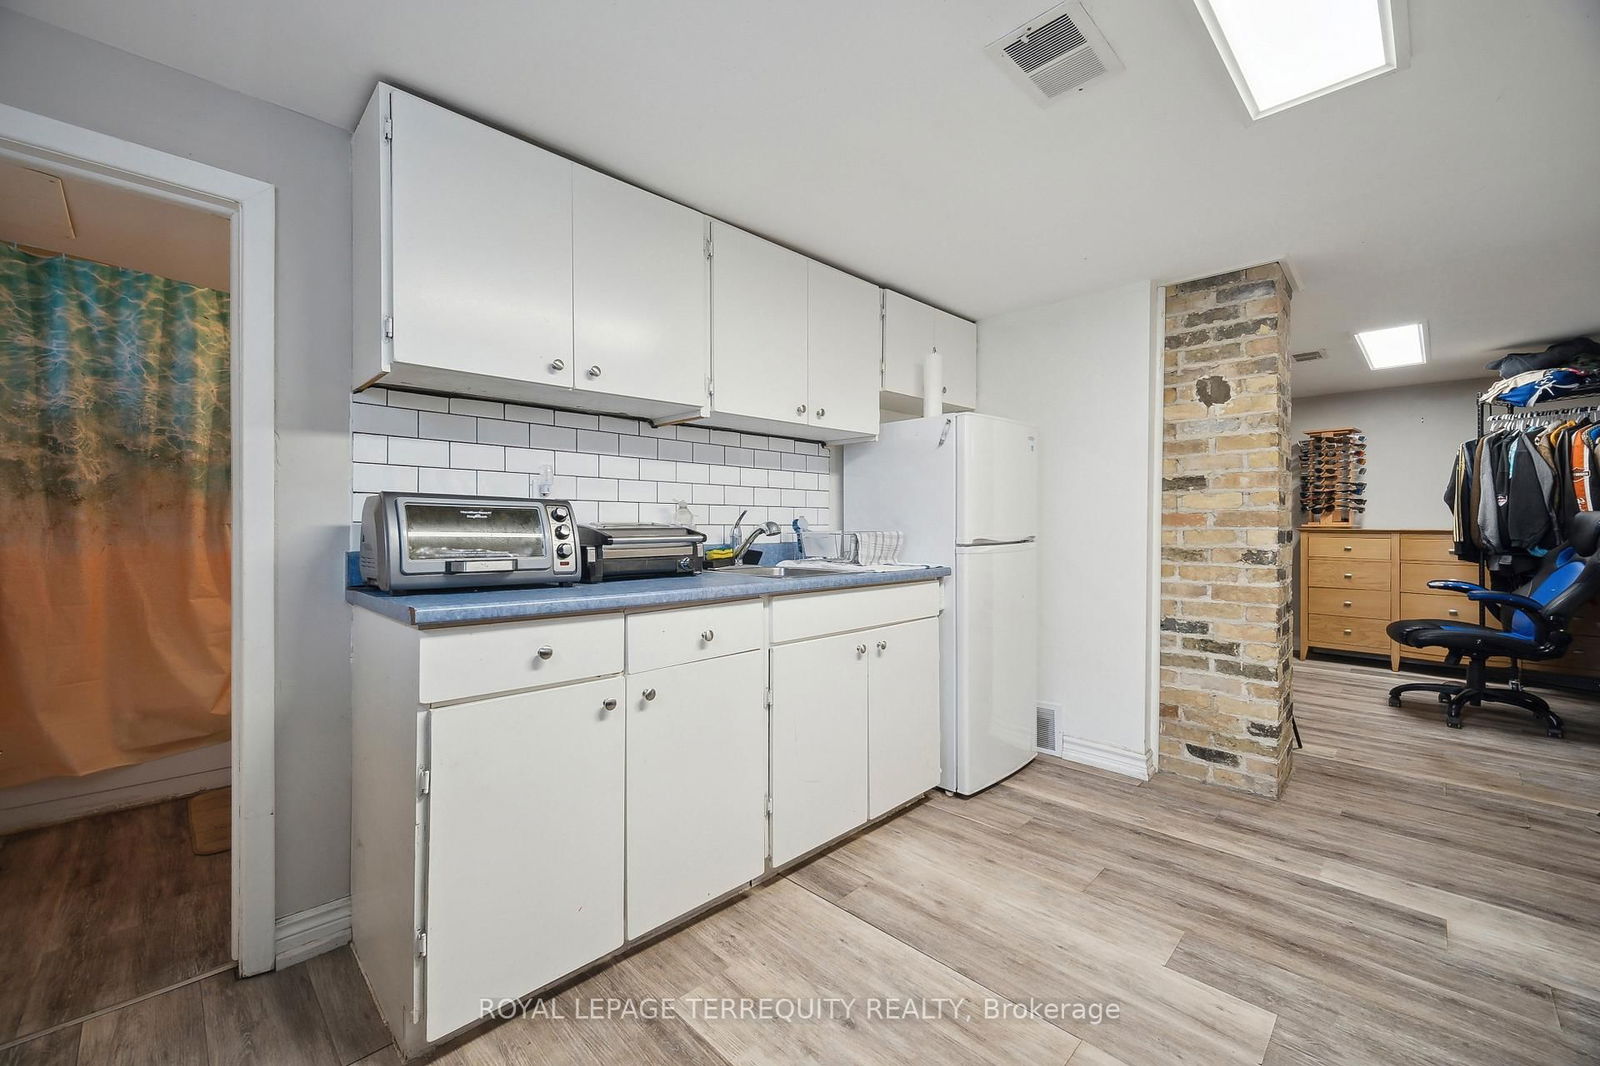
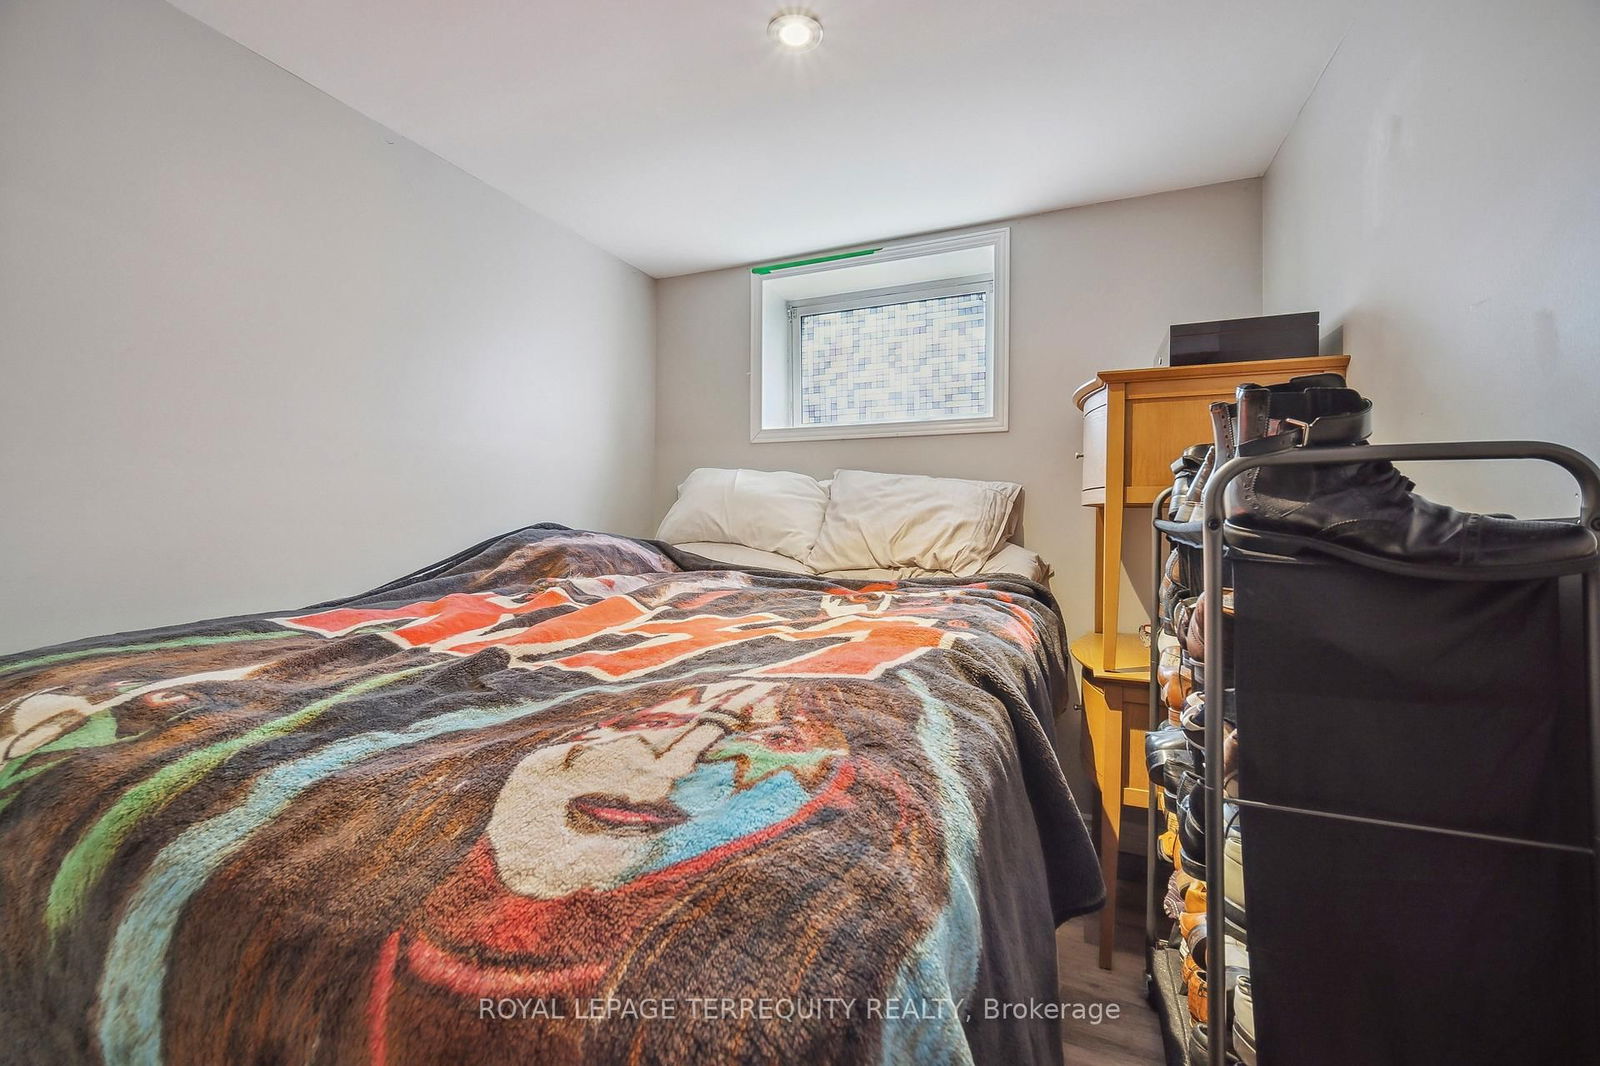
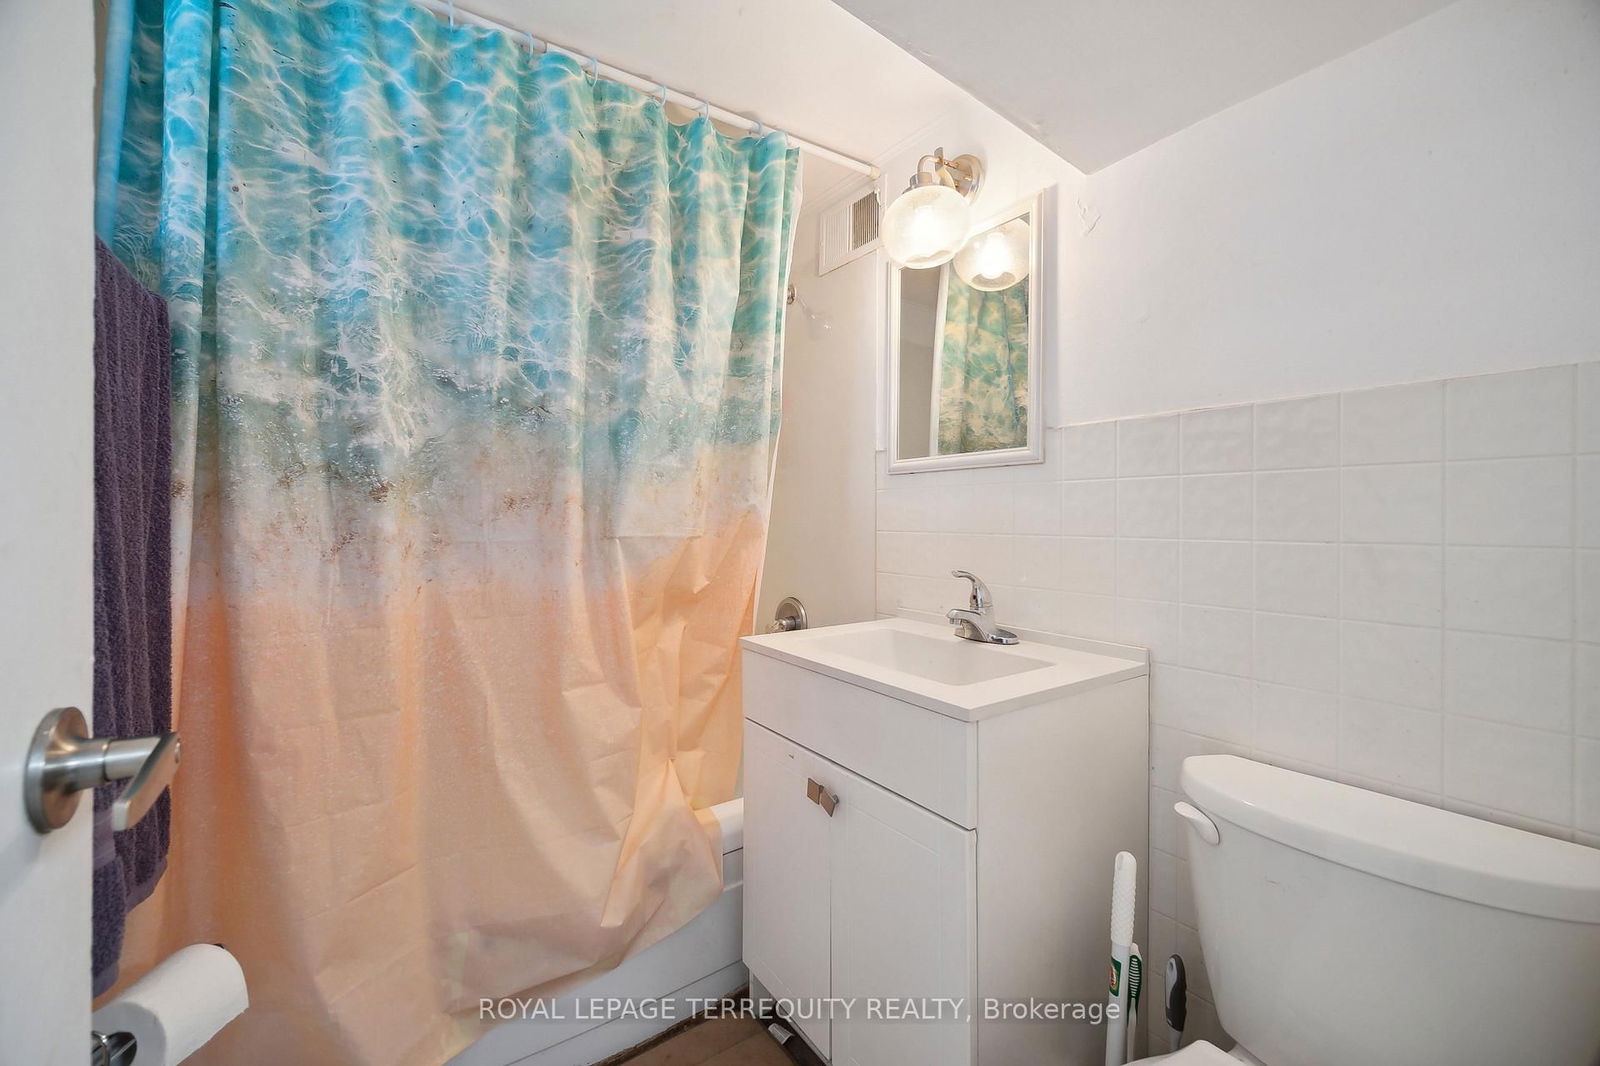
This 2+1 Generously Sized Bedrooms Bungalow Features 2 Kitchens and is Close to Western University, Western Fair and the Vibrant Old East Village, Just Minutes from Downtown and Several Colleges. It Includes a 1-Bedroom in-Law Suite in the Lower Level with a Separate Entrance, Which Will Surely Add Value for he Discerning Buyer. The Main Floor's Open-Concept Layout Harmoniously Integrates the Living, Dining, and Kitchen Areas. The 2 Bedrooms Boast Large Windows that Flood the Interior with Natural Light, Complemented by a 4-Piece Bath. Hardwood Floors. All Smooth Ceilings. There are Two Basements. The Separate Entrance Basement Includes an Additional Bedroom, Kitchen, Full Bath, and Laundry Facilities. Carpet Free. The Detached Garage is Fully Renovated. This is a Great Opportunity to Own a Solid Home on a Rare Deep Lot South-Facing Sunny, Fully Fenced Backyard and Deck is Perfect for Outdoor Entertaining and Features a Storage Shed. The Property Provides One Detached Garage and 3 Add Additional Parking Spots. The Garage will be Finished by the end of the Month. One of the Tenants is Willing to Stay, Presenting Immediate Cash Flow and is Just 5 Minutes Away from triOS Business Tech Campus, Fanshawe College, North American Trade School, Park, Arena and more. This Property is Ideally Suited for First-Time Homebuyers, Investors, or Downsizers. The Exterior and Interior were Painted in 2024, with 2024 Refinished Hardwood Main Floors. New Washer. 2025 Fully Renovated Garage.
2024 Painted Exterior, 2024 Painted Interior. 2024 Refinished Hardwood Floor. 2024 New Washer. Dryer, 2025 Fully Renovated Garage. 2 STOVES, 2 FRIDGES, Range Hood, 2 WASHERS, 1 DRYER, All Electrical Light Fixtures and Coverings.
Primary
2nd Br
Bathroom
Kitchen
Living
2nd Br
Kitchen
Bathroom
Sitting
The graph below compares the average list price and average sale price of homes in this neighborhood by month for the last 24 months. When average sale price is greater than average list price, this may suggest a buyer's market. When average sale price is lower than the average list price this may suggest a seller's market.
The graph below illustrates the average days on market for homes in this neighborhood. The yellow area may indicate a buyer's market, the green area may indicate a balanced market and the red area may indicate a seller's market.
Sales Representative, Century 21 People’s Choice Realty Inc., Brokerage
(647) 576 - 2100